
Ever feel like your notes are a tangled web of unrelated points?
If you’re dealing with dense, comparison-heavy material—especially in subjects like history, law, medicine, or project meetings—linear note-taking can become more confusing than helpful. The Charting Method is a clean, structured alternative that transforms complexity into clarity.
What Is the Charting Note-Taking Method?
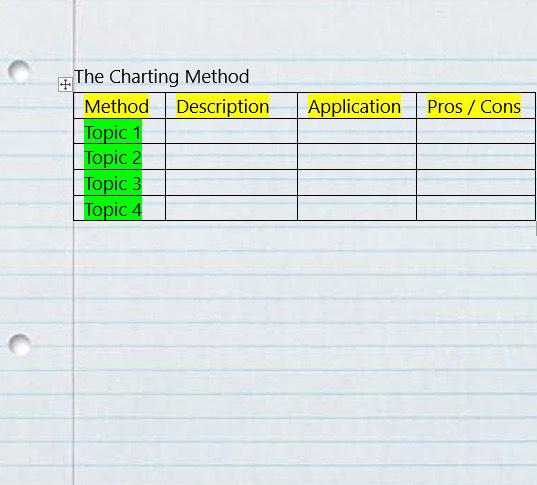
The Charting Method is exactly what it sounds like: a way to take notes in chart or table format, using clearly defined columns that you customize based on the topic. This method allows you to sort details into categories on the fly—perfect for fast lectures, workshops, or strategic meetings.
Instead of writing point after point, you write across columns—grouping related content together visually.
Example:
| Topic | Key Point | Date | Relevance | Next Step |
|---|
This format keeps your notes digestible and makes reviewing faster and more intuitive.
Who Benefits Most From the Charting Method?
- Students in fields like biology, economics, or history
- Professionals working in analytics, law, healthcare, or operations
- Team leaders who need to track decisions, ownership, and deadlines
- Visual thinkers who find order soothing and information-heavy lectures overwhelming
Use Cases: Where Charting Shines
🟠 In School:
Use it for tracking timelines, distinguishing between concepts, and memorizing structured information like chemical properties or economic models.
🟠 During Studying:
Ideal for organizing summaries, creating quick-reference sheets, or comparing theories side by side.
🟠 In Meetings:
Build charts in real-time using headers like “Topic,” “Who,” “Decision,” and “Deadline” to quickly turn discussion into action items.
🟠 In General Learning:
When consuming books or courses, use a template to capture key takeaways without losing context.
Why It Works
Cognitive science shows that structured visuals enhance comprehension and memory. When we see information aligned and grouped, our brains create stronger mental associations. This is particularly useful when you need to review, compare, or present what you’ve learned.
Tips to Get Started
- Pre-define your columns: Based on your topic, decide what categories will be useful.
- Leave space to expand: Your chart might grow—make sure your layout is flexible.
- Use digital or paper formats: Notion, Excel, or a simple notebook all work.
- Color-code or highlight for quick scanning during review.
The Charting Method is especially valuable when clarity and comparison are non-negotiable. If you’re overwhelmed by complex material or tired of reviewing scattered notes, try laying things out in a table—and let structure do the heavy lifting.
Explore more methods in our full guide:
👉 Mastering the Art of Note-Taking: The Best Methods for Retaining Information
What’s your favorite way to organize messy ideas?
Follow us on Instagram, LinkedIn, Pinterest, and Facebook for more productivity tips and tools. And don’t forget to sign up for our newsletter to get exclusive resources and updates straight to your inbox!


Leave a reply to Mastering the Art of Note-Taking: The Best Methods for Retaining Information – Roya Bloom Cancel reply